
How to Look Up Washington County Jail Population Data
Population data is not the same as the live roster. The roster shows who is in custody right now. Population data shows totals and trends over time. Those numbers come from the Sheriff's reports, the county budget and quorum court materials, and national datasets that compile jail figures. Each source updates on its own schedule, so a figure is a snapshot tied to a date, not a live count.
Use the sources in this order, depending on what you need.
| Data Need | Where to Look |
|---|---|
| Current count and bookings | Sheriff's detainee roster and recent list |
| Capacity and staffing | Sheriff annual reports, county budget, quorum court |
| State and national context | Bureau of Justice Statistics |
| County trend over years | Vera Institute county data |
| Arkansas profile | Prison Policy Initiative |
The named datasets are linked further down. For the live custody view, use the inmate records page.
Washington County Jail Capacity Overview
The county jail is the Washington County Detention Center on Clydesdale Drive in south Fayetteville, run by the Sheriff's Office. The current building took its detainee population in March 2005, and a 2006 renovation added roughly 100 beds. The official sources reviewed here did not publish a single current rated-capacity number, so confirm the exact figure with the Sheriff's reports or county budget before you cite it.
| Facility | Function | Capacity Figure |
|---|---|---|
| Washington County Detention Center | Pretrial, county-sentenced, holds and transfers | Confirm current rated capacity with Sheriff reports |
The current roster changes daily, so a capacity figure is best read against a dated population count from the same report. The Sheriff is the custodian of the county jail, and the office's annual and budget materials are the most direct local source for capacity, beds added or removed, and staffing tied to the facility. When those documents and a national dataset disagree, the county's own report usually reflects the most current local picture.
Average Daily Population
Average daily population, or ADP, is the average number of people held over a period, like a month or a year. It smooths out day-to-day swings and is the standard way jails report their load. A single roster count can mislead, because numbers rise and fall with bookings, court dates, and releases. ADP gives a steadier picture.
ADP for the county is reported in Sheriff and budget documents and compiled in national datasets. When you compare ADP against rated capacity, you get a sense of how full the jail runs. Pull both figures from the same dated report so the comparison is fair. A jail that runs near or over its rated capacity faces different pressures than one with room to spare, which is why ADP and capacity are usually read as a pair. Watch the date on each figure, since a number from two years ago may not match the jail today.
Demographic Breakdown
Researchers track who is held, not just how many. A demographic breakdown can include sex, race or ethnicity, and age bands. These figures help explain who passes through a county jail and how that compares to the wider population. The official sources reviewed did not publish a current county demographic table, so use the Sheriff's reports and the national datasets for the actual numbers.
The metrics below are the ones worth collecting when you build a profile of the Washington County jail.
| Metric | What It Measures |
|---|---|
| Sex breakdown | Male and female counts. |
| Race and ethnicity | Population shares by group. |
| Age bands | Distribution across age ranges. |
| Annual bookings | Total intakes over a year. |
| Average length of stay | Typical days held per person. |
Pretrial vs Sentenced Population
A county jail holds two broad groups. Pretrial detainees are people held while their cases are pending, before any conviction. Sentenced inmates are serving a term, usually a shorter county sentence. The split matters, because a large pretrial share points to people held before trial, often tied to bond. National research from the Bureau of Justice Statistics and the Prison Policy Initiative shows pretrial detention makes up a large part of many county jails.
For the Washington County figure, use the Sheriff's reports and the compiled datasets. Mark clearly whether a number you cite is county-specific or a state or national figure, since they are easy to mix up. The pretrial share also connects to bond practice. People who cannot post bond may stay in custody while their cases move, which is why bond reform and pretrial data draw so much attention in jail research. The court case behind a pretrial hold shows the bond order and the hearing schedule.
Misdemeanor vs Felony Population
The jail also holds people on different charge levels. Misdemeanor cases are lower-level offenses, often from district court. Felony cases are the more serious matters in Circuit Court, and people held on felonies may wait longer for resolution or transfer to a state prison. The mix shifts with arrests, court schedules, and transfers, so it is a moving target.
The court side of these cases lives in Search ARCourts. The court records page covers how to pull the case behind a charge, and the arrest records page covers the booking side.
Mental Health and Medical Population
Jails also carry a medical and mental-health caseload, and that load shapes staffing and cost. Public population reports may note the share of people who need medical or mental-health services, though specific clinical details are confidential. The Sheriff's budget and reports are the place to look for staffing and program lines tied to this caseload.
Individual medical and mental-health information never appears in public roster or population data. That is protected, and only the totals or program-level figures may be reported. The mental-health caseload also links to specialty courts, since drug court and treatment programs aim to move some people out of the jail and into supervised treatment instead.
National and State Context
To judge a county figure, you need a yardstick. The Bureau of Justice Statistics publishes national jail data that sets the baseline for capacity, ADP, and the pretrial share. Reading the county number next to the national one shows whether the local jail runs high, low, or about average.
The Bureau of Justice Statistics site, shown above, is the national source. Open it at bjs.ojp.gov. For an Arkansas-specific view, the Prison Policy Initiative profile breaks the state down.
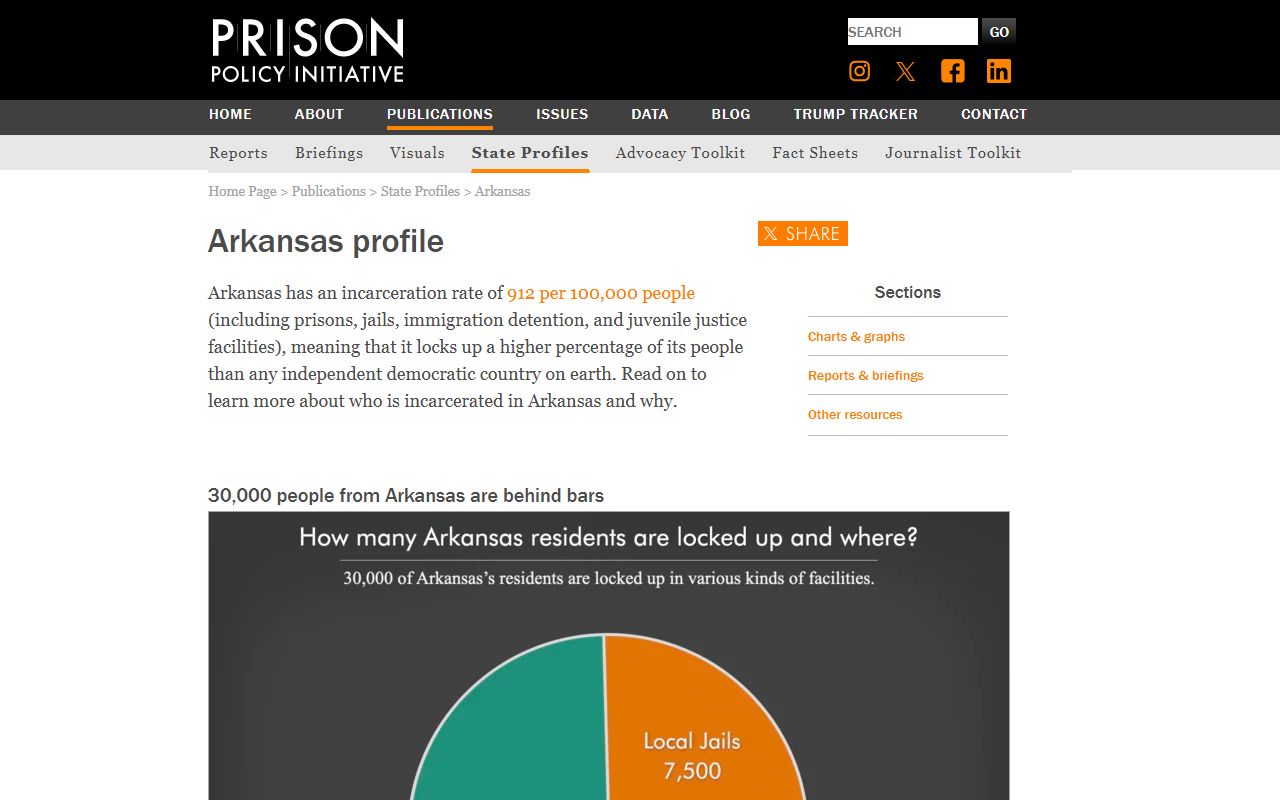
The Prison Policy Initiative Arkansas profile, shown here, puts state incarceration in context. Read it at the Arkansas profile. For county-level trends, the Vera Institute county data tool is the place to compare years.
Comparing County, State, and National Rates
The fair way to compare jails of different sizes is a rate per 100,000 residents, not a raw count. A small county and a large county can hold very different totals yet have similar rates. To compare Washington County to Arkansas and to the nation, pull each rate from its source rather than guessing. The table shows where each level's figure lives and what it tells you.
| Level | Where to Find the Rate | What It Tells You |
|---|---|---|
| County | Vera county data, Sheriff reports | Local incarceration per 100,000. |
| State | Prison Policy Initiative Arkansas profile | Arkansas rate for comparison. |
| National | Bureau of Justice Statistics | U.S. baseline rate. |
Always label whether a figure is county, state, or national. Mixing the three is the most common mistake in reading jail data.
Population Trends Over Time
A single year tells you little. A trend across several years tells you a lot. The Vera county data tool and county budget documents let you line up figures across years to see whether the jail population rose or fell. Many U.S. counties saw jail populations drop in the early part of the pandemic, then recover unevenly, but you should not assume Washington County followed that pattern without the county's own numbers.
So treat trend claims with care. Pull the dated figures, line them up, and let the numbers speak. The growth of the Fayetteville and Springdale area can raise filings and arrests over time, which is one reason local trend data is worth checking directly. A rising county population does not automatically mean a rising jail population, because policy, court speed, and bond practice all play a part. Let the county's own year-over-year figures, rather than assumptions, drive any conclusion about the trend.
Searching for Washington County Inmate Records by Name
This page is about population data, not individual records. To look up a specific person, use the jail roster instead. A name search shows current custody, booking, and charges for one person, while the figures here describe the whole population. The inmate records page covers the name search and the roster fields.
Where the Data Comes From
Each number has an origin. The live count comes from the Sheriff's jail-management system through the public roster. Capacity, ADP, and staffing come from Sheriff reports, the county budget, and quorum court materials. State and national context comes from the Bureau of Justice Statistics, the Prison Policy Initiative, and the Vera Institute. Knowing the source lets you weigh how current and how comparable a figure is.
Note: Always mark a figure as county, state, or national, and tie it to the dated report it came from, so the comparison stays honest.